Visualization software
The visualization software enables the creation of integration period, daily, monthly and annual statistics, which can then also be exported to Excel for further evaluation. Used as a measuring unit without parameterization, the maximum-level monitor records the load curves. This makes it possible to generate statistics – as a basis for customers for negotiating cheaper contracts with the relevant power supply companies.
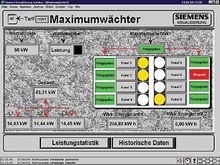
The software is available as an option for EIB visualization and as a stand-alone version.It enables online tracking from your PC and modification of the switching priorities. It also displays the current switch status and the important system parameters.
The statistics of an integration period over 15 minutes normally shows the following:
- Light and dark: demanded power (incl. base load)
- Light: the switched off power
- Dark: the released power (incl. base load)
The following is typical: slight power underrange at the start and slight power overrange at the end of the integration period. Taken over the entire length of the integration period, this leads to a balanced ratio.
The "daily behavior" evaluation function shows individual integration periods. The disabled and released power show the demanded power of all devices. If the devices are switched manually, power overranges are unavoidable. In spite of modifications to power demands, the maximum-level monitor limits the released power, thus preventing the permissible limit value from being exceeded.
The historical database displays the switching states of the channels as they occur – based on the given priority and requirements.
Системные требования
ДЛя отдельной версии програмного обеспечения
|
Персональный компьютер (ПК)
|
|
Тип:
|
IBM совместимый
|
|
Процессор:
|
Pentium P5 133 MHz или выше
|
|
Оперативная память (RAM):
|
32 MB
|
|
Видеокарта:
|
мин. 256 цвтов
|
|
Операционная система:
|
Windows 95/98/98Me/NT/2000
|
|
Интерфейс:
|
для подключения
-
instabus EIB, один последовательный интерфейс(RS 232)
- принтера, один параллельныйинтерфейс.
|
Статистика
Доступные версии:
- встроенная в визуализацию как станлартная
- отдельная версия
| 


